The Metrics tab is usually the last menu option on the Admin interface. ****
![]()
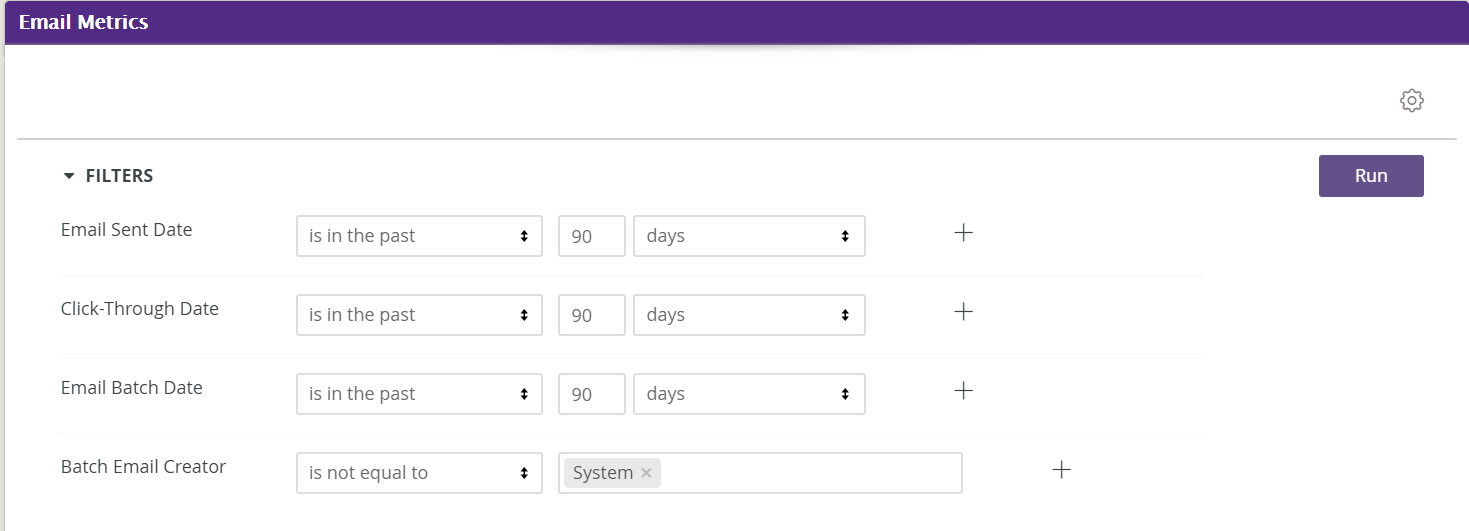
Email Metrics
Click on filters to adjust Email Sent Date, Click-Through Date, Email Batch Date and Batch Email Creator (system or admin user). Click on Run to update metrics below based on filters.
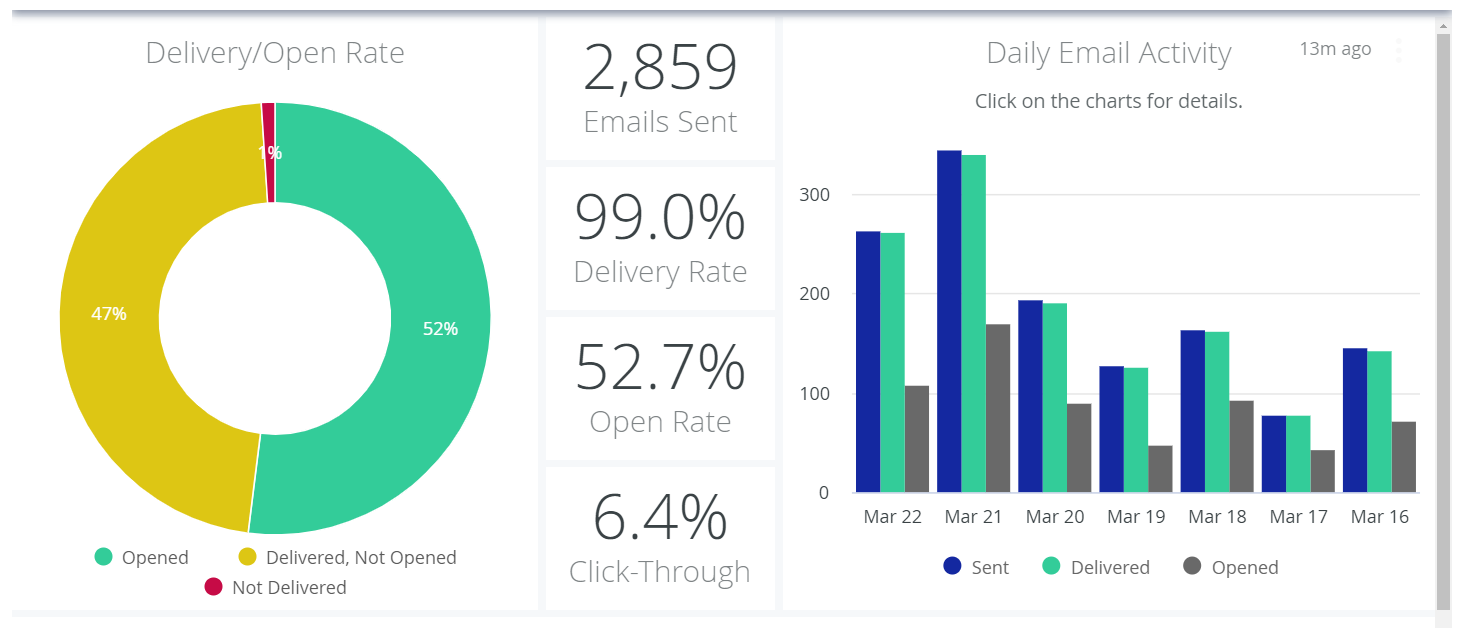
These filters generate charts and grids showing delivery rate, open rate and click-through rate. A Daily Email Activity chart will also display.
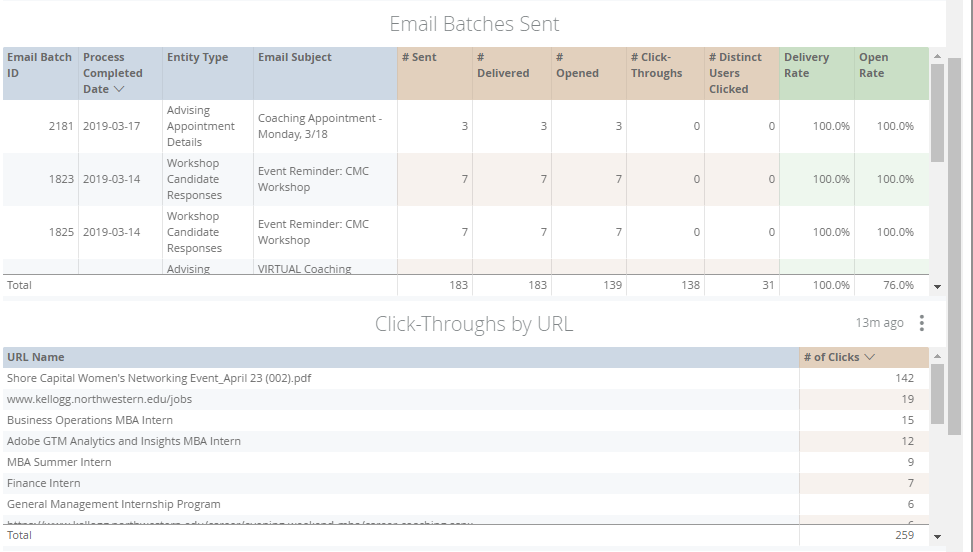
To Download Data, hover in the right hand corner above the grid and click on the hamburger icon.
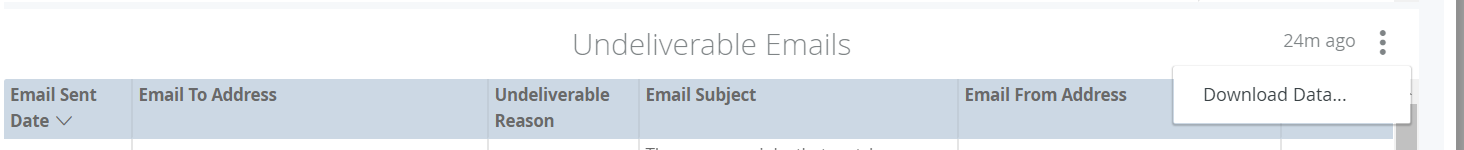
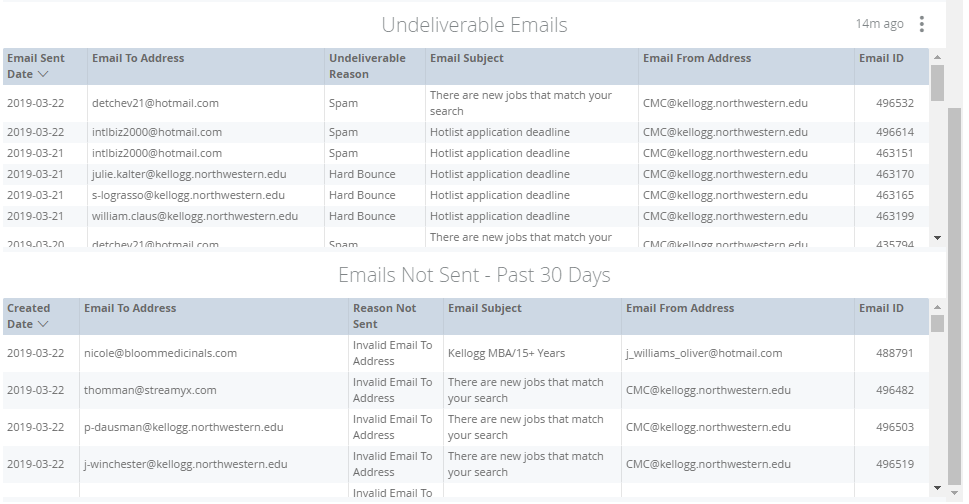
Information on Undeliverable Emails is also available.
Undeliverable Reason Definitions:
- Blocked by Attachment – The recipient's email server will not accept the attachment that was sent
- Hard Bounce – The recipient's email address is not valid
- Sender Unknown – The recipient's email server does not recognize the sender's email domain in combination with the IP that sent the email
- Spam – Similar to Sender Unknown; the recipient's email server does not recognize the sender's email domain in combination with the IP that sent the email and considers the message to be spam
Reasons Not Sent Definitions
- Email Body Missing – the system will not send blank emails
- Invalid Email To Address – The potential recipient's email address is not well-formed, or has previously been undeliverable, and the system will not send again
- Invalid Email From Address – The Sender's ”from” email address is not well-formed.
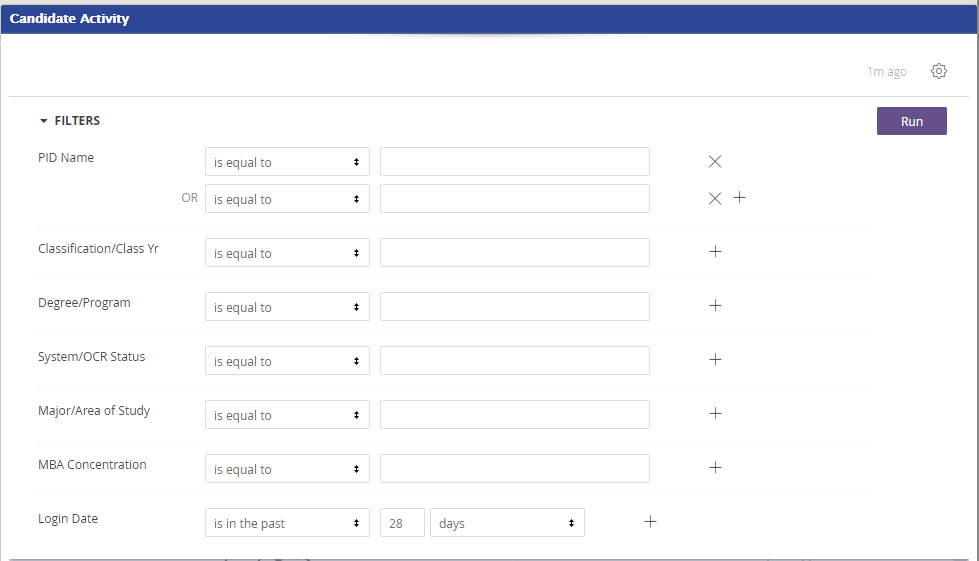
Candidate Activity
Click filters and adjust the PID Name, Classification Yr, Degree/Program, System/OCR Status, Major/Area of Study, MBA Concentration and Login Data by clicking the box with the arrows and selecting desired criteria. Click on Run.
Total Current Candidates displays candidates you're viewing based on the criteria you selected above.
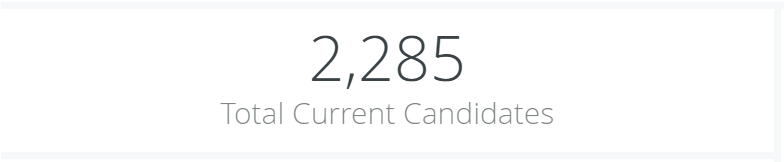
By clicking on this number, you can view more specific Details including Full Names and Email Addresses.
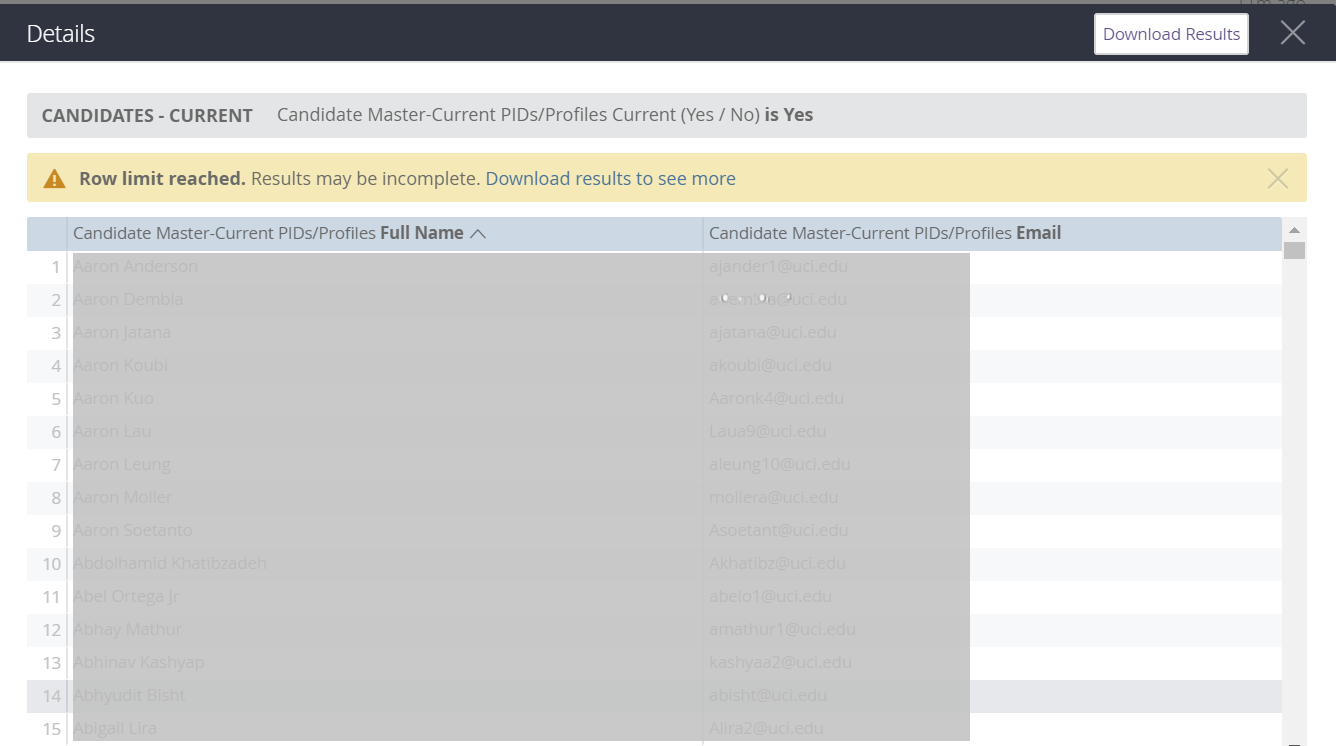
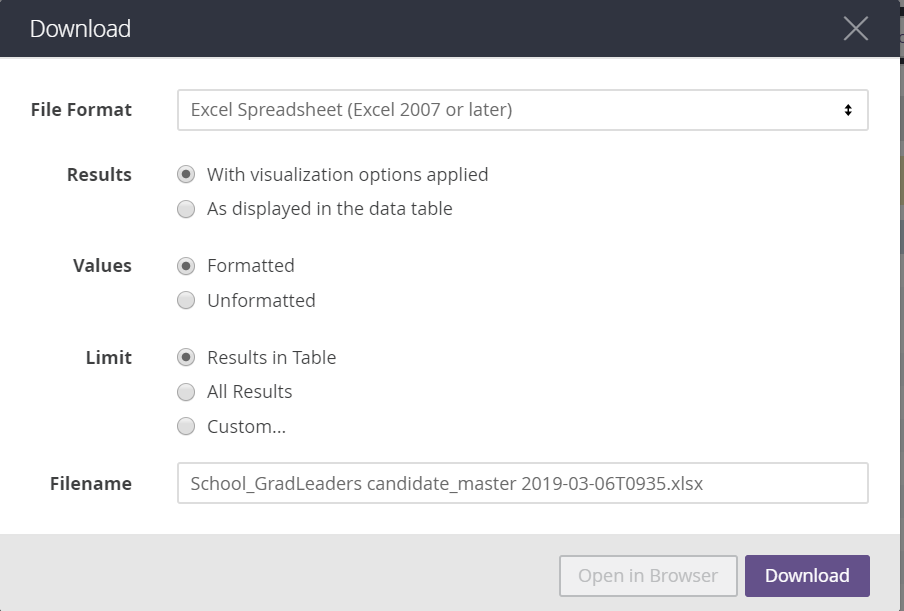
These results can be downloaded by clicking on Download Results. Options are given for formatting.
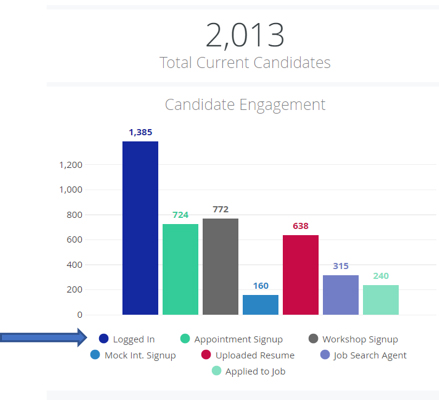
Candidate Engagement visually displays the portion of candidates out of the total number in your system who completed the following actions:
- Logged in
- Workshop Signup
- Uploaded Resume
- Applied to Job
- Appointment Signup
- Mock Interview Signup
- Job Search Agent
By clicking any of the colored circles, you can omit that activity from your view.
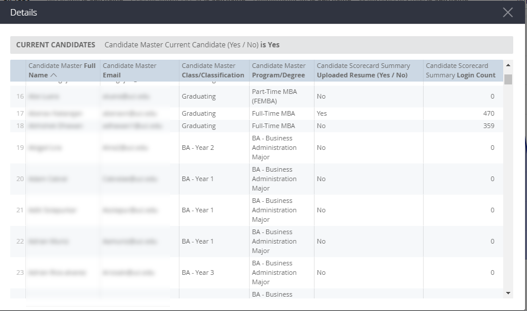
By clicking any bar on the bar graph, you can see Details including Full Name, Email, Class/Classification, Program/Degree, Resume Upload Status and Login Count.
The Download Data hamburger button enables you to export and download data. You will see this on the right hand side of all visuals.
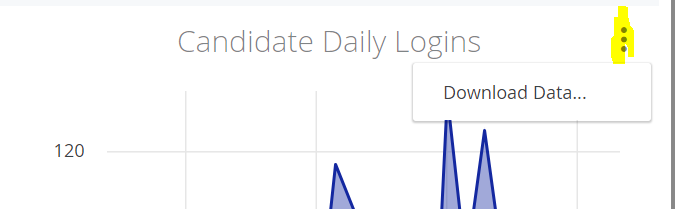
Candidate Daily Logins uses a line graph to depict the total number of candidates logging in on a daily basis. Simply hover on any part of the line graph to view the Login Date and Number of Logins.
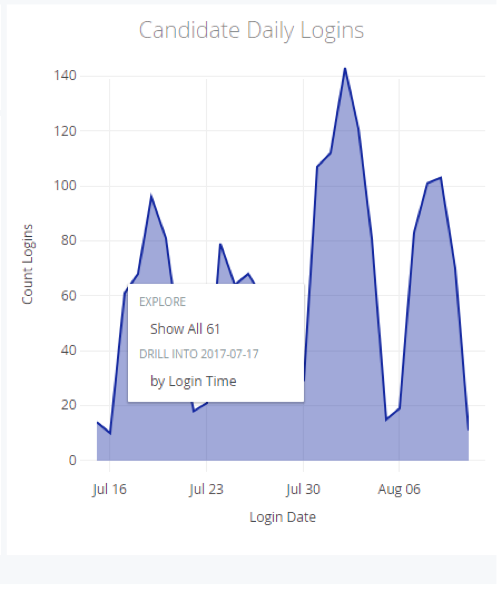
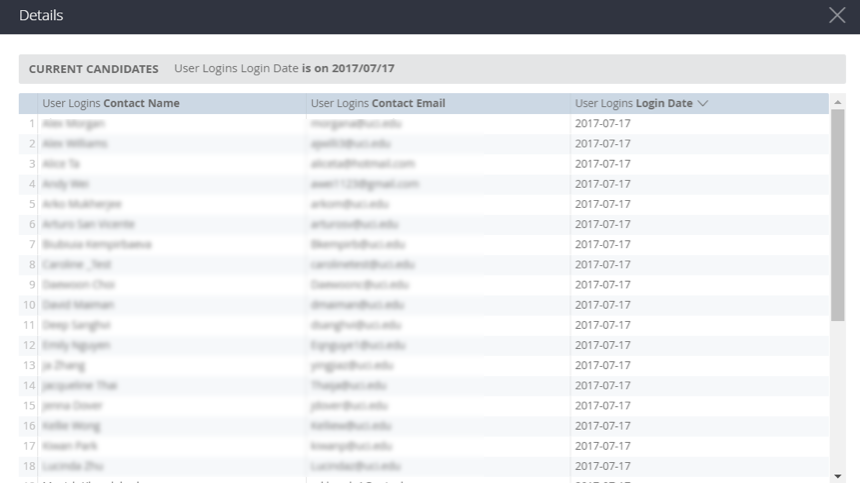
Click to view advanced Details including Contact Name, Contact Email and User Login Dates.
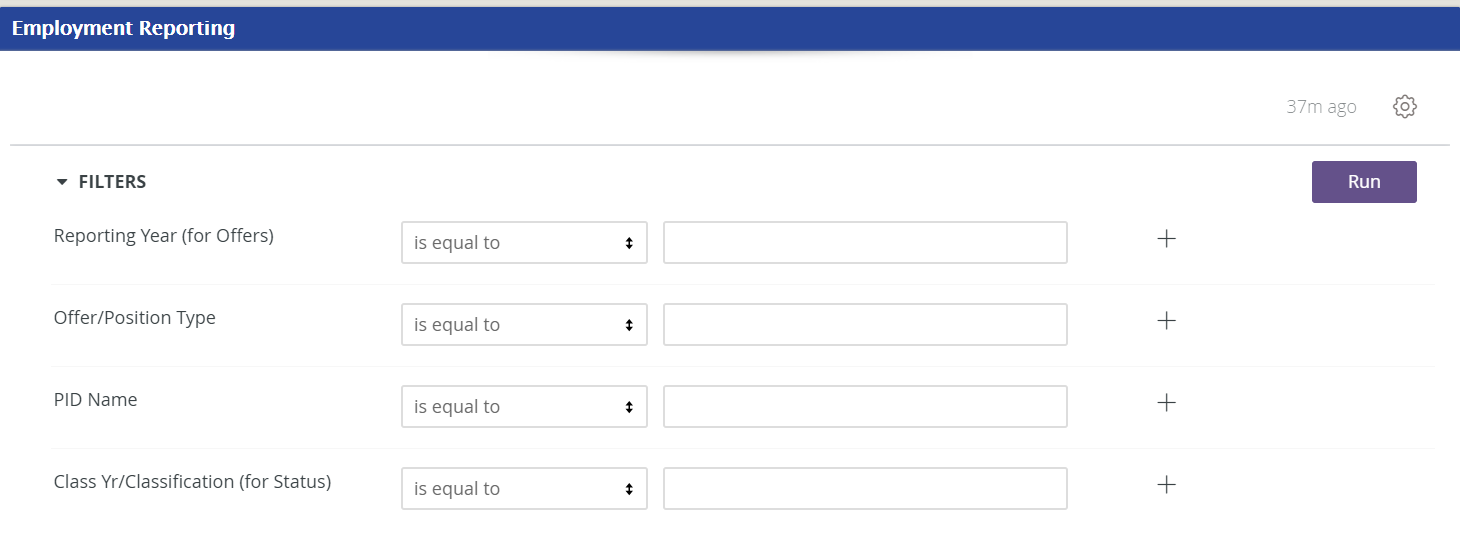
The next main widget you'll see is Employment Reporting.
Click filters and adjust the Reporting year, Offer/Position Type, PID Name and Class Yr/Classification by clicking the box with the arrows and selecting desired criteria. Click Run.
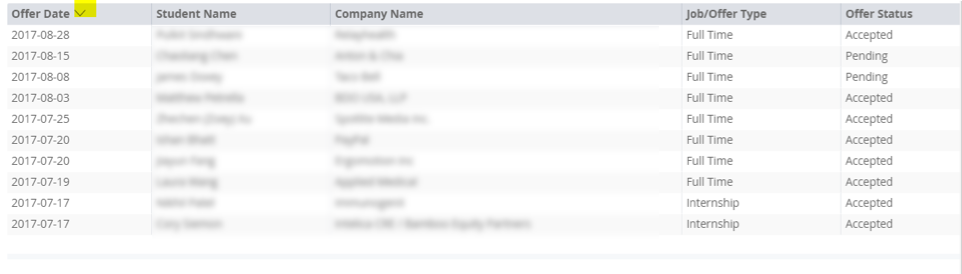
10 Most Recent Job Offers shows an information grid with Offer Date, Student Name, Company Name, Job/Offer Type and Offer Status. By clicking the arrows next to the field name, you can sort by ascending or descending order.
Employment Status offers an at-a-glance view of the percentage of students who have taken any of the following actions in relation to reporting their employment status:
- Unknown
- Seeking
- Accepted Full-Time Offer
- Not Seeking
- Not Seeking- Starting a new business as a business owner
- Not Seeking- Sponsored or already employed when entering the program
- Not Seeking-Postponing job search
- Not Seeking-Continuing education past the MBA degree
- Seeking-Offer pending
- Seeking-Offer Withdrawn
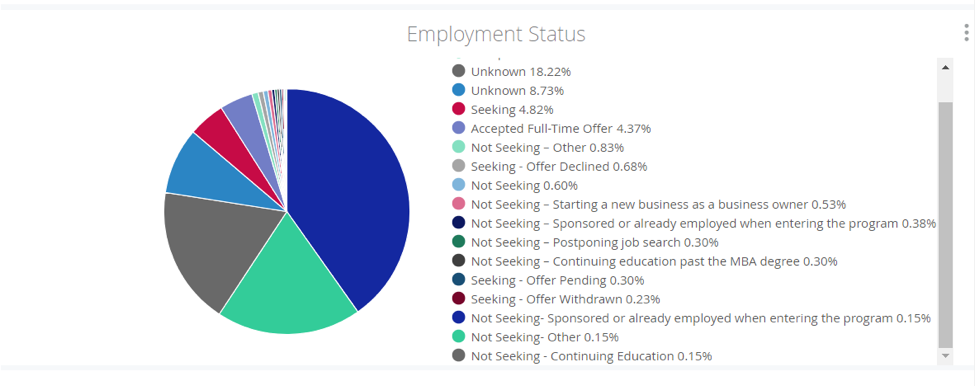
You can hover over any piece in the pie chart to view candidate counts associated to each action, or click within a segment to view Details including full names and email addresses.
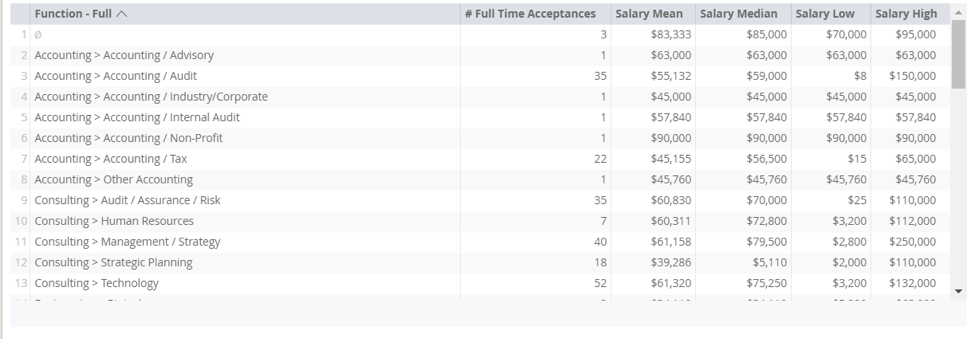
Salaries by Job Function is a chart view that includes Function Name, # of Full-Time Acceptances, Salary Mean, Salary Median, Salary Low and Salary High. By clicking the arrows next to the field name, you can sort by ascending or descending alphabetical order.
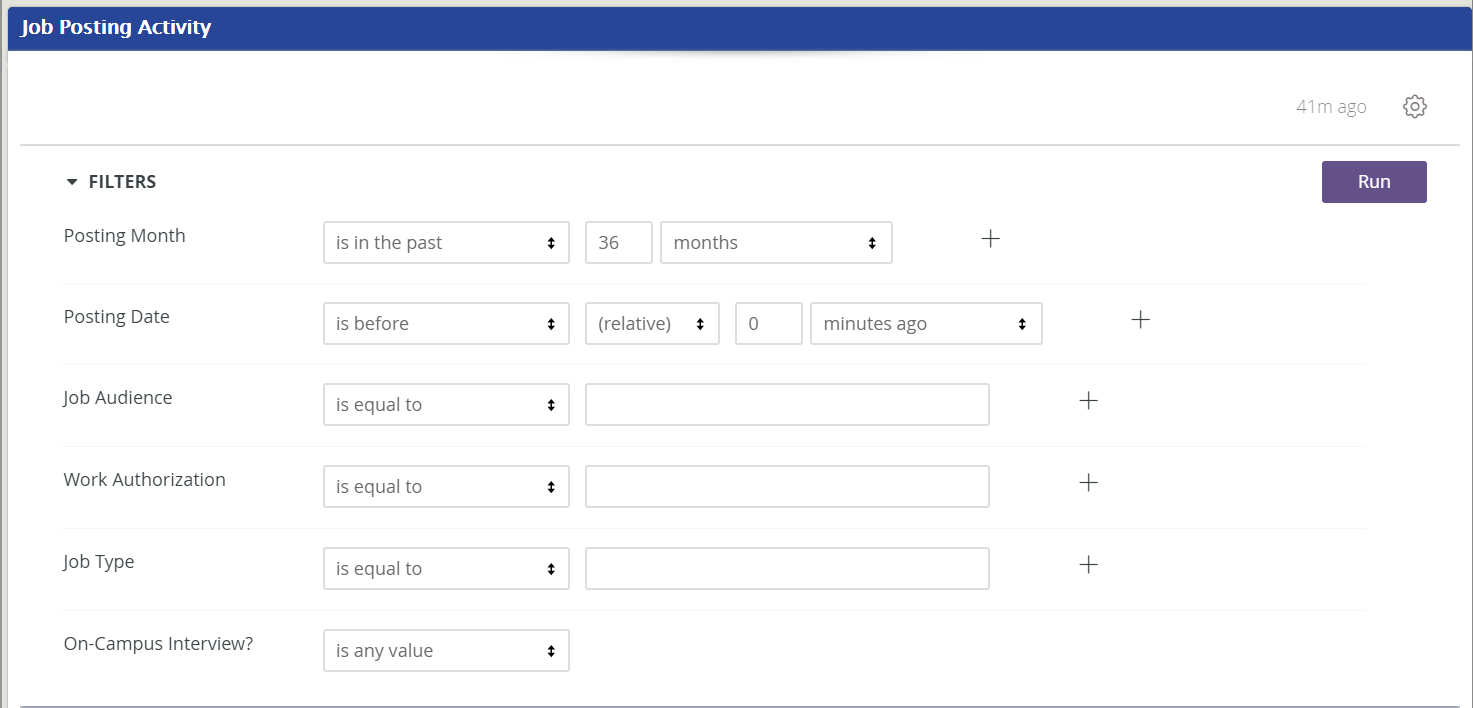
The next main widget you'll see is Job Posting Activity.
Click filters and adjust the Posting Month, Posting Date, Job Audience, Work Authorization, Job Type, and On-Campus Interview (Yes or No) by clicking the box with the arrows and selecting desired criteria. Click Run.
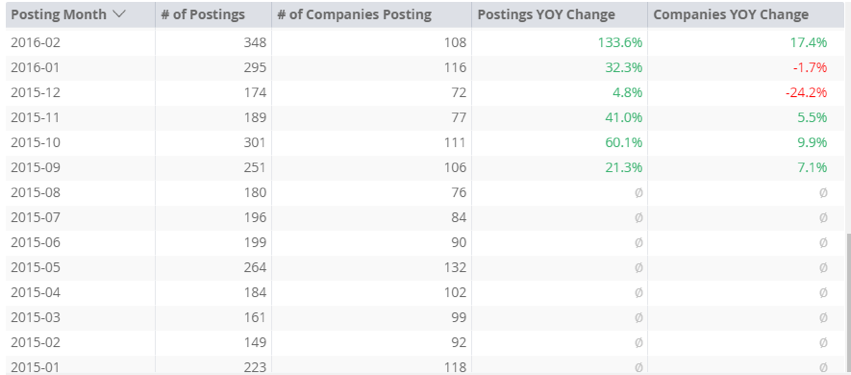
Monthly Job Postings shows a grid view of Posting Month, # of Postings, # of Companies Postings, Postings YOY Change and Companies YOY Change. By clicking the arrows next to the field name, you can sort by ascending or descending order.
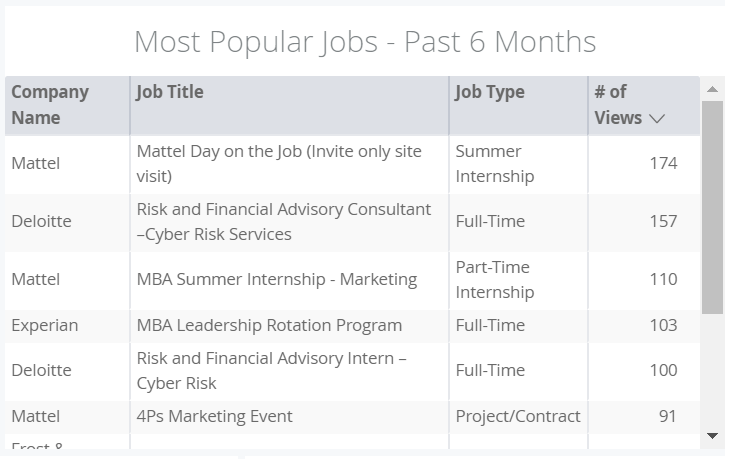
Most Popular Jobs - Past 6 Months shows the jobs with the most views over the last 6 months.
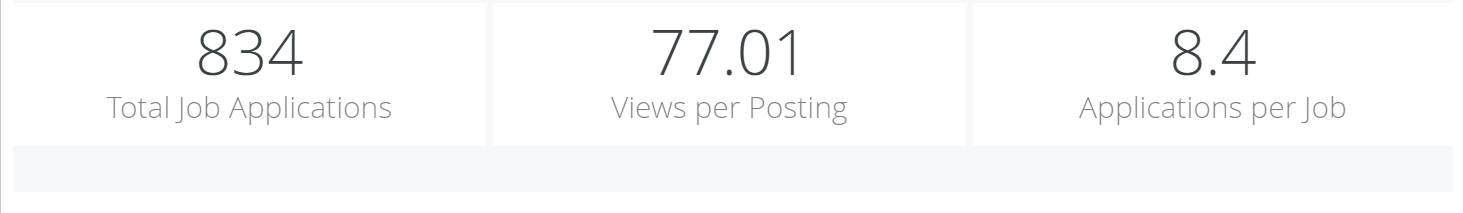
The large numbers to the right of the grid chart display main metrics to highlight including Views Per Posting, Total Job Applications and Applications per Job. By clicking each large number, you can view the Details.
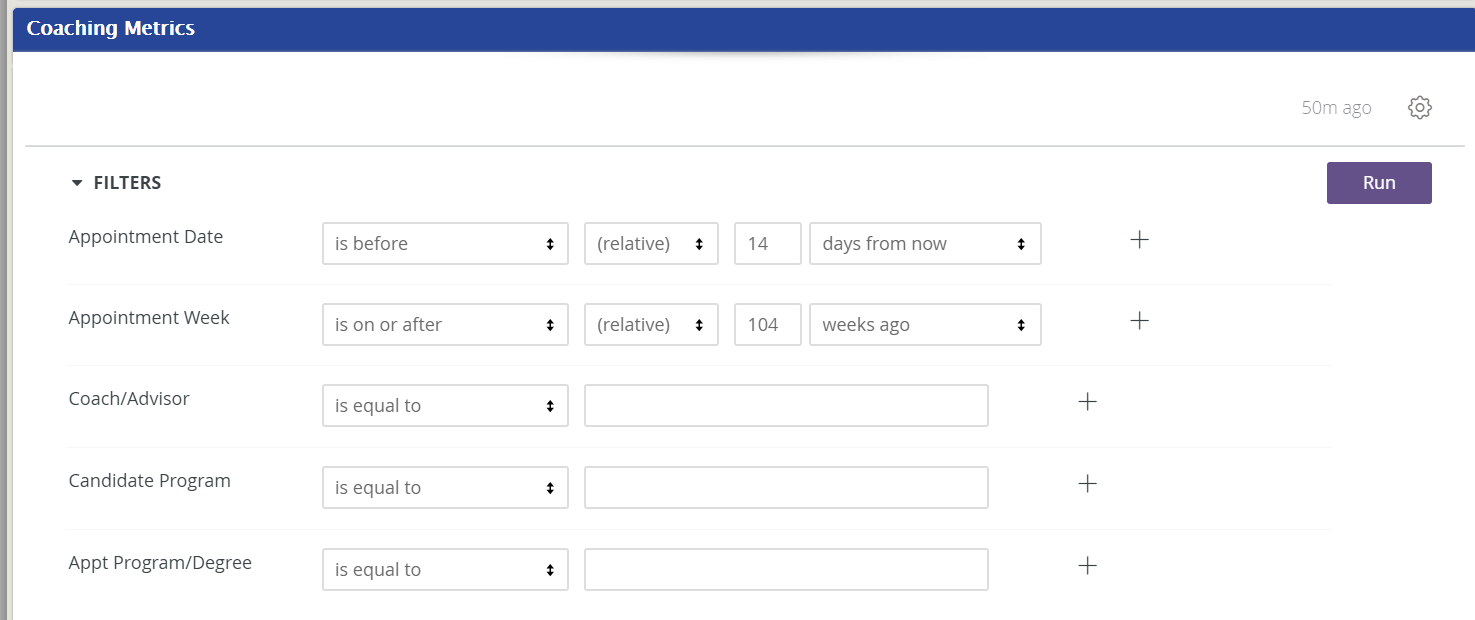
The next main widget you'll see is Coaching Metrics. Click filters and adjust the Appointment Date, Appointment Week, Coach/Advisor, Candidate Program and Appt Program/Degree by clicking the box with the arrows and selecting desired criteria. Click Run.
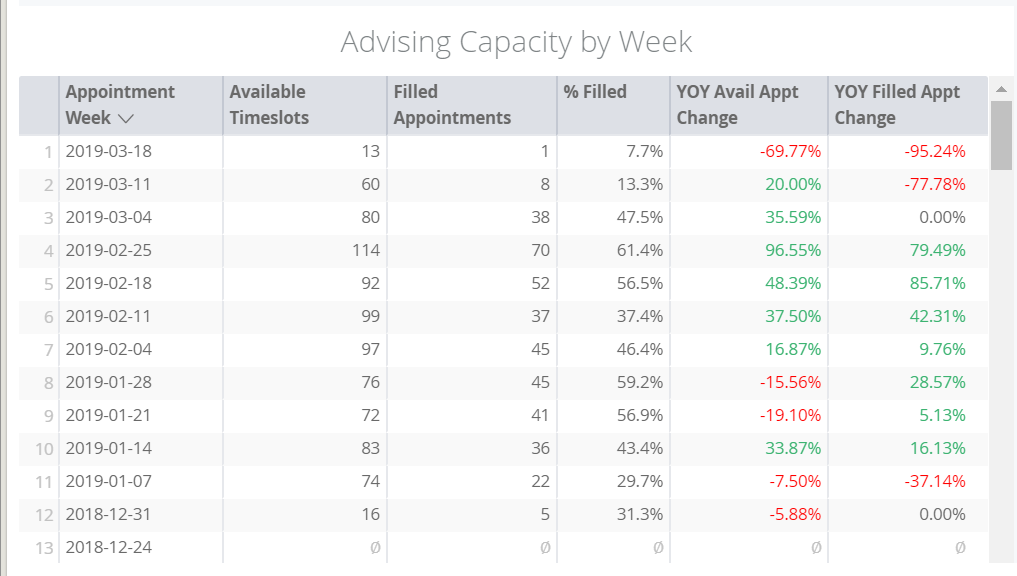
Advising Capacity by Week offers a grid display of Appointment Week, Available Timeslots, Filled Appointments, % Filled, YOY Available Appointment Change and YOY Filled Appointment Change by percentages. By clicking the arrows next to the field name, you can sort by ascending or descending order.
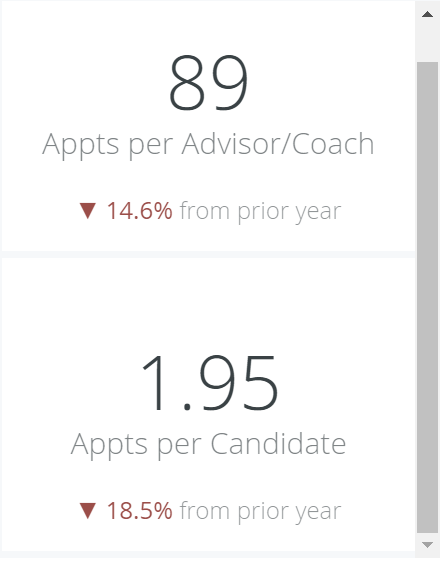
The large numbers to the right of the grid chart display main metrics to highlight including Appointments Per Advisor/Coach (including progress compared to the prior year),and Appointments per Candidate (including progress compared to the prior year). By clicking each large number, you can view the Details.
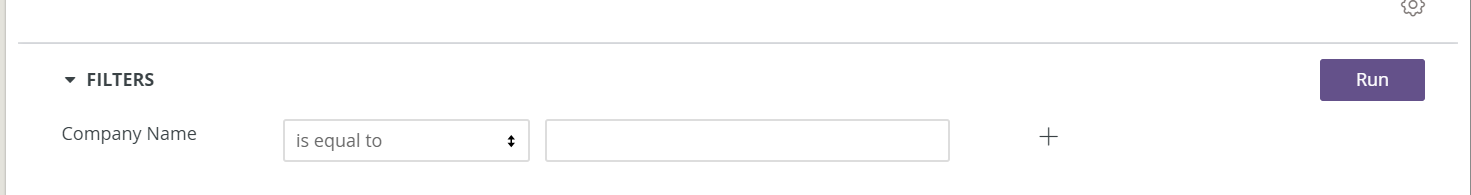
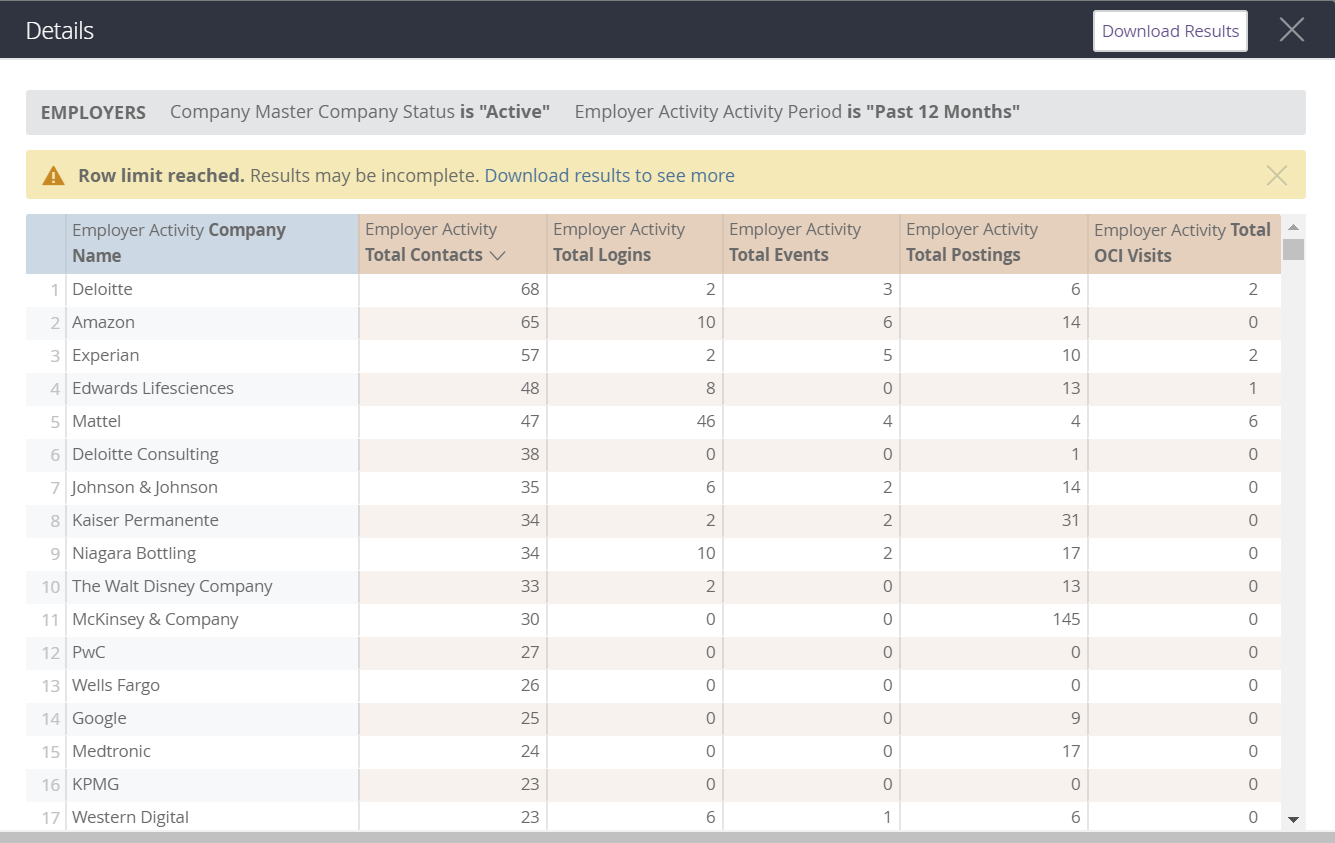
Employer Engagement offers a grid display of Company Activity Summary with Company Name, Company Status, Total Contacts, Total Postings, Total Events and Total OCI Visits.
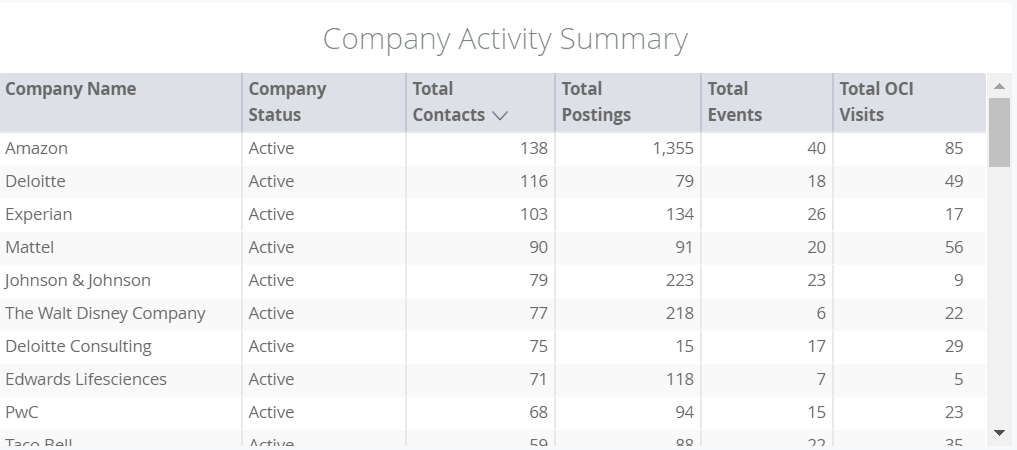
This widget offers a filter to drill down to one company.
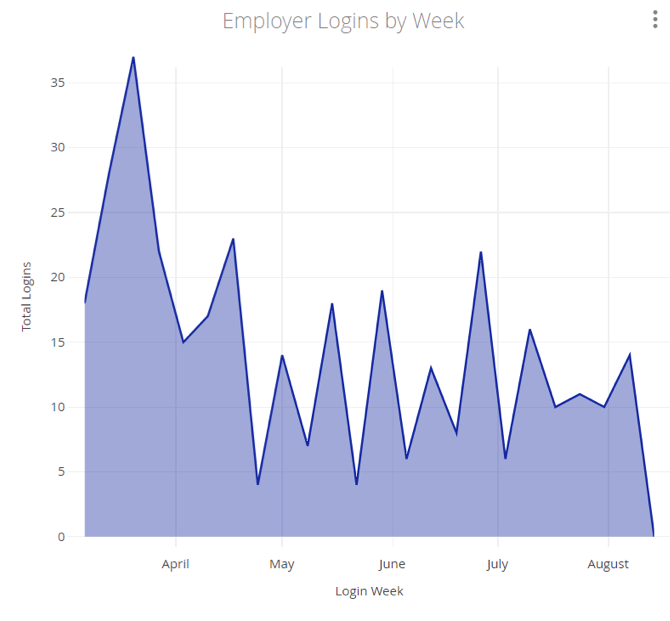
Employer Logins by Week uses a line graph display to give you an at-a-glance view of the employers interacting with your career center platform. Simply hover on any part of the line graph to view the Login Week and Number of Logins, or click to drill down into Details including Contact Name, Email and Login Date.
The large numbers to the right of the grid chart display main metrics to highlight including Job Postings-Past 12 Months (including progress compared to the prior year) Events-Past 12 Months (including progress compared to the prior year), and OCI Visits-Past 12 Months (including progress compared to the prior year).
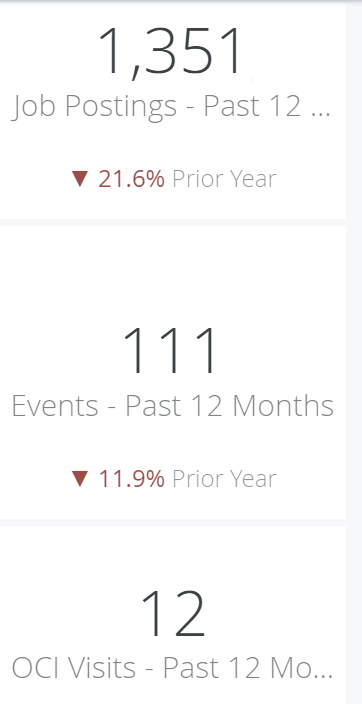
By clicking each large number, you can view the Details.
- Email Body Missing – the system will not send blank emails
- Invalid Email To Address – The potential recipient's email address is not well-formed, or has previously been undeliverable, and the system will not send again
- Invalid Email From Address – The Sender's ”from” email address is not well-formed.


 Add Comment